California Car Accident Statistics and Trends: Key Insights for Safer Driving
Driving in California means navigating a landscape unlike anywhere else in the nation. From the crowded freeways of Los Angeles to foggy stretches of the Pacific Coast Highway and winding mountain roads leading to Lake Tahoe, the Golden State presents drivers with an extraordinary range of conditions. Understanding California car accident statistics can help you recognize where and why crashes happen—and what you can do to reduce your personal risk.
This article breaks down the latest statewide data, regional patterns, leading causes, and practical safety strategies tailored specifically for California roads. Whether you commute through the San Francisco Bay Area, travel to national parks in the Sierra Nevada, or drive rural routes through the Central Valley, these insights can inform smarter decisions behind the wheel.
Key Takeaways
- Recent statewide statistics: California traffic fatalities decreased to 4,061 in 2023, down nearly 11% from 4,539 in 2022 according to the California Office of Traffic Safety (OTS). The rate of fatalities per 100 million vehicle miles traveled fell from 1.34 in 2022 to 1.26 in 2023. California averages roughly 9 to 12 deaths per day from traffic-related incidents.
- Regional crash patterns differ significantly: Los Angeles County consistently reports the highest crash totals, with congested freeways like I-5 and I-405 contributing to risk. San Diego experiences elevated pedestrian crashes near beach areas. The San Francisco Bay Area sees high rear-end collision rates on bridges and in stop-and-go traffic. The Central Valley faces fog-related pileups and fatigue crashes on long highway stretches. The Inland Empire has seen rising serious crash rates tied to suburban growth and longer commutes.
- California climate and geography shape risk: Weather varies dramatically across regions—wet winters in northern California bring hydroplaning hazards, while the Central Valley experiences dangerous tule fog. Mountain routes to destinations like Lake Tahoe, Yosemite, and other national parks present ice, steep grades, and wildlife crossings. Mojave Desert corridors add heat-related vehicle failures and dust storms.
- Statistics inform safer choices: Knowing that speeding was involved in roughly 32% of all traffic fatalities in 2023 encourages you to ease off the accelerator, especially in poor conditions. Recognizing high-risk areas helps you plan routes, adjust speed, and allow extra travel time.
- Statistics are historical and illustrative: Results vary by situation and location. If you or a passenger are injured in a crash, 1-800-THE-LAW2 can help connect you with independent California car accident attorneys for a free consultation. Legal services are provided by independent attorneys.
Overview of Car Accident Trends in California
This section provides a data-driven snapshot of how frequently car accidents occur across California and why these numbers matter for everyday drivers. Understanding scale and trends helps put your own driving environment into perspective.
Recent Statewide Numbers
According to the National Highway Traffic Safety Administration, California consistently ranks among the states with the highest number of car accidents annually, largely due to its large population and extensive road network. The California Office of Traffic Safety reported that in 2019, there were over 200,000 reported injuries due to car accidents in the state. More recent data shows:
- Total reported collisions: SWITRS data estimates nearly 500,000 reported collisions annually statewide—approximately 1,370 crashes per day.
- Fatalities: California recorded 4,061 traffic fatalities in 2023, and in 2024, California recorded a 6.3% decrease in traffic deaths from the previous year, totaling 3,807 fatalities, with an estimated 43% decline projected for 2025.
- Injuries: California reported 165,978 injuries resulting from traffic collisions in 2022, a decline of approximately 7.3% from 2021. In California, there were approximately 3,600 fatalities from motor vehicle accidents in 2020, marking a significant increase from previous years due to pandemic-related behavioral shifts.
These figures come from OTS, CHP, and NHTSA sources and are periodically updated. Final validation of statistics typically lags 1-2 years, so recent years may reflect preliminary estimates.
Trend Comparisons
California has seen a substantial reduction in traffic fatalities, recording a nearly 11% decrease from 2022 to 2023 and a dramatic 43% drop in the first half of 2025. Compared to five years ago, current numbers reflect meaningful progress, though fatalities remain approximately 10-15% above 2018 levels when adjusted for vehicle miles traveled (VMT) growth.
Population and Per-Mile Risk Context
California’s 39 million residents and over 300 billion annual vehicle miles traveled inflate raw accident counts. California has historically had a higher fatality rate per 100,000 residents compared to the national average, with approximately 5.3 fatalities per 100,000 residents versus the national rate of approximately 4.4. However, the mileage death rate of 1.26 fatalities per 100 million VMT is actually below the national average and significantly lower than rural states with higher per-mile risks, which is important context when reviewing any car accident timeline from wreck to potential compensation.
Human Factors Persist
Even with improvements in vehicle technology—automatic braking, lane-departure warnings, and advanced driver assistance systems—common human factors like speeding, distraction, and impairment still heavily drive collision risk. Driver distraction is a leading cause of car accidents in California, with activities such as texting, talking on the phone, and eating contributing significantly to crashes. Individual behavior changes can meaningfully reduce your chance of being involved in a crash, and the broader legal practice areas available through 1-800-THE-LAW2’s network can address many consequences that follow serious collisions.
Regional Hotspots: Where Crashes Happen Most Often
Crash risk is not evenly spread across California state. Dense urban cores, commuter corridors, and tourism gateways experience higher collision rates than rural areas with less traffic. Understanding where crashes concentrate helps you adjust your approach when driving through unfamiliar territory.
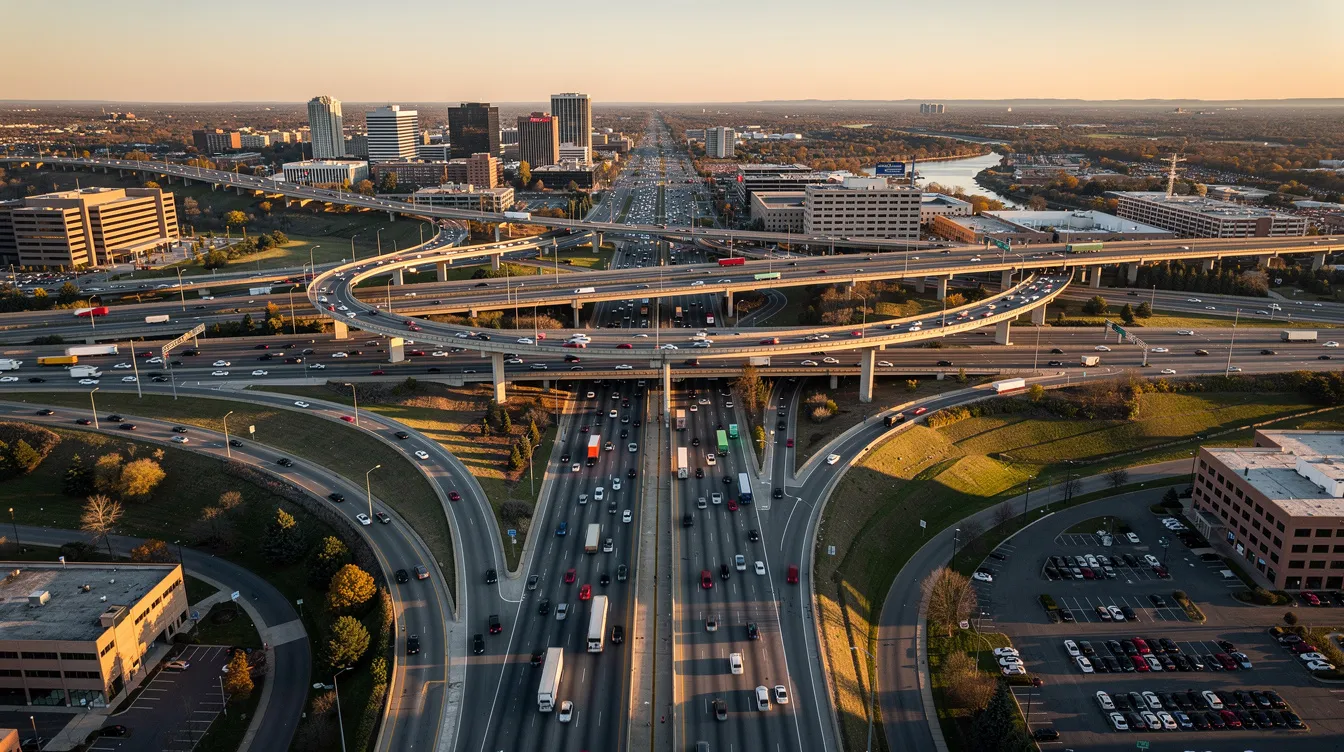
Greater Los Angeles Area
Los Angeles County regularly reports some of the state’s highest totals of traffic collisions and traffic fatalities. Recent data shows approximately 50,328 crashes in LA County, with 658 fatal crashes documented in a single recent year. High traffic volume in urban areas like Los Angeles contributes to a higher likelihood of accidents, as congested roads can lead to aggressive driving behaviors and increased chances of collisions, and many injured people choose to consult a Los Angeles personal injury lawyer after serious crashes.
Key factors include:
- Heavy congestion on I-5, I-10, US-101, and I-405
- Commuter peak hours generating 25% more rear-end collisions
- Hollywood, downtown, and beach areas seeing elevated pedestrian risk
San Diego Region
San Diego recorded approximately 16,732 crashes in recent data, with patterns tied to border traffic, coastal tourism, and major corridors including I-5, I-8, and SR-163. Pedestrian and bicycle crashes are a particular concern in core San Diego neighborhoods and beach areas, with pedestrian fatalities running approximately 25% above the state average in certain zones.
San Francisco Bay Area
The San Francisco Bay Area presents unique challenges from bridge congestion, dense arterials, and steep hills. San Francisco alone recorded over 10,254 crashes in recent data. The Golden Gate Bridge and Bay Bridge approaches see elevated collision rates according to Caltrans. Common crash types include:
- Rear-end collisions in stop-and-go traffic
- Side-impact crashes at urban intersections
- Incidents on bridge on-ramps during peak hours
High traffic volume in urban areas like San Francisco contributes to a higher likelihood of accidents.
Central Valley
The Central Valley’s long, straight highways (I-5, SR-99) host significant agricultural trucking traffic. This region sees elevated high-speed and fatigue-related crashes, with approximately 20% of fatal crashes involving speed or fatigue. Sacramento and Fresno each record roughly 5,670-5,722 crashes annually, and nearby communities such as Pasadena also see significant traffic collision volumes where a Pasadena personal injury attorney can assist injured residents.
Seasonal hazards include:
- Tule fog causing multi-vehicle pileups (historically, incidents have injured dozens)
- Limited visibility dropping to near-zero during fog events
- Long-haul driver fatigue on routes connecting the north and south of the state
Inland Empire
The Inland Empire (including cities in Riverside and San Bernardino counties) has experienced rising serious crash rates tied to suburban sprawl. Freeways like I-15, I-215, and SR-60 serve commuters traveling between bedroom communities and job centers in Los Angeles or Orange County, and injured drivers in this region may benefit from speaking with a San Bernardino car accident lawyer. Factors include:
- Average commutes of 45 minutes or longer
- Higher speeds on open stretches
- Rapidly changing road networks as development expands
Northern California and Rural Areas
Northern California, including approaches to the Sierra Nevada, Lake Tahoe region, and routes to national parks like Yosemite and Sequoia & Kings Canyon, presents distinct hazards:
- Two-lane mountain roads with limited guardrails
- Wildlife crossings (deer collisions peak October through December)
- Weather-related risks including snow, ice, and rockfall
- Per-mile fatality rates approximately twice the urban average
Drivers venturing to northwestern California, the northern coast, or through redwood forests should plan for different conditions than metropolitan areas.
Navigating High-Risk Areas
Pay extra attention when driving in unfamiliar high-risk regions. Plan routes in advance using tools like Caltrans QuickMap, allow more travel time, and adjust speed to local traffic and road conditions. What works on a familiar urban route may not suit a foggy agricultural highway or winding mountain pass.
Leading Causes of Car Accidents in California
This section organizes CHP and OTS data into plain-language categories so you can identify which behaviors most often precede crashes and injuries—and what changes might help.
Speeding
Speeding remains a primary cause of motor vehicle fatalities in California, contributing to nearly one-third of all crashes. Speeding was involved in roughly 32% of all traffic fatalities in 2023. Exceeding posted limits or driving too fast for conditions is consistently linked with severe-injury and fatal crashes.
Practical adjustments:
- Ease off the accelerator on freeways, especially in wet weather, fog, or heavy traffic
- Reduce speed by 10% in rain or limited visibility
- Treat posted limits as maximums, not targets
Distracted Driving
Driver distraction is a leading cause of car accidents in California. Common distractions include smartphone use (texting, navigation input while moving), in-car screens, eating, and passenger interactions. California’s hands-free law has helped reduce phone-related crashes, but enforcement gaps persist.
Practical adjustments:
- Enable “Do Not Disturb While Driving” on your phone
- Set navigation before departing
- Pull over safely for calls when possible
- Avoid eating or complex tasks while driving
Impaired Driving
Alcohol-impaired driving accounted for 1,355 deaths in 2023. Impaired driving (alcohol and drugs) claims approximately 30% of California traffic fatalities annually. Beyond alcohol, cannabis (with THC-positive drivers increasing significantly in crashes since 2016 legalization) and prescription medications can reduce reaction time and judgment.
Practical adjustments:
- Designate a sober driver before any event involving alcohol
- Understand that legal medications may still impair driving
- Use rideshare services when impairment is possible
Failure to Yield and Unsafe Turns
Intersection crashes—left turns across traffic, rolling through stop signs, red-light running—are a major source of injuries for drivers, cyclists, and pedestrians. These crashes often result in severe side-impact collisions.
Practical adjustments:
- Make full stops at stop signs
- Scan crosswalks before turning
- Wait for clear gaps when turning left
- Avoid “yellow light” acceleration
Fatigue and Long-Distance Driving
Drowsy driving risk connects directly to long commutes between regions like the Central Valley and Bay Area or between Los Angeles and the Inland Empire. Microsleeps at highway speeds can have consequences equivalent to impaired driving, and knowing what to do when injured in a car accident can be critical if fatigue contributes to a crash.
Practical adjustments:
- Take breaks every 2 hours on long trips
- Share driving duties when traveling with others
- Avoid late-night returns after full workdays
- Recognize early fatigue signs (heavy eyelids, drifting lanes)
Overlapping Factors
Many collisions involve multiple factors—speed combined with distraction, or impairment plus fatigue. Multi-factor situations can multiply crash risk significantly. Reducing even one risky habit can meaningfully lower your chance of being involved in a crash.
How California’s Roads, Climate, and Natural Environment Affect Crash Risk
California’s diverse landscapes—from crowded cities to mountain passes, coastal highways, and national parks—shape when and where crashes happen. Understanding how geography and California climate interact with traffic helps you prepare for conditions beyond your usual routes.
Climate and Seasonal Patterns
California’s Mediterranean climate creates distinct hazards across seasons:
| Season | Region | Primary Hazards |
|---|---|---|
| Dry summer | Central Valley, southern California | Glare, heat-related vehicle failures, wildfire smoke reducing visibility |
| Wet winter | Northern California, coast | Slick roads, hydroplaning, increased stopping distances |
| Year-round | Mountains | Snow, ice, black ice, rockfall |
| Poor weather conditions, including rain and fog, can lead to increased accident rates in California, as they reduce visibility and road traction. OTS data shows wet conditions correlate with approximately 25% higher fatality rates. Annual precipitation varies dramatically—from over 40 inches in parts of northern California to minimal rain in the Mojave Desert. |
Mountainous and Forested Areas
Routes through the Sierra Nevada to Lake Tahoe, Yosemite, Sequoia & Kings Canyon, and other national parks present:
- Tight curves and steep grades
- Limited guardrails in some areas
- Rapid weather changes with snow, ice, and rockfall
- Mount Whitney and surrounding peaks creating localized weather patterns
Safe practices:
- Use lower gears on descents
- Carry chains when required (mandatory November through April on many routes)
- Avoid sudden braking on icy or gravel roads
- Check Caltrans road conditions before departure
Coastal and Bay Area Driving
Pacific Coast Highway, routes around Monterey Bay, and roads approaching the San Francisco Bay present:
- Narrow lanes along cliffs
- Strong crosswinds from the Pacific Ocean
- Dense fog reducing visibility to near-zero
- Tourist traffic unfamiliar with local conditions
Recommendations:
- Maintain cautious speeds on coastal routes
- Increase following distance significantly in fog
- Use extra care around scenic pullouts and overlooks along the coast
Desert and Rural Corridors
Inland Empire outskirts, Mojave Desert routes, and Central Valley farm roads bring different hazards:
- Heat-related vehicle failures (tire blowouts, overheating)
- Dust storms reducing visibility below 100 feet
- Nighttime wildlife crossings (bighorn sheep, coyotes, deer)
- Very high speeds on open highways with minimal traffic
Tips:
- Check coolant and tires before long desert trips
- Carry water and emergency supplies
- Dim high beams for oncoming traffic while watching the right road edge
- Stay alert for agricultural equipment on farm roads
Natural Resources and Infrastructure
California’s natural resources drive heavy truck traffic in certain corridors. Agricultural production, port operations, and goods movement from warehouses create concentrated trucking on I-5 through the Central Valley, routes serving the Sacramento River delta, and corridors near Death Valley and desert mining operations. Trucks are approximately four times deadlier per ton-mile in collisions with smaller vehicles.
Adjustments:
- Leave extra space when following or passing trucks
- Avoid lingering in blind spots
- Recognize that stopping distances for trucks are much longer than for cars
Summary
Understanding how geography, California climate, and weather interact with traffic patterns helps you adjust speed, route choice, and trip timing. Checking conditions before traveling through diverse landscapes—whether redwood trees along the northern coast, the Sacramento area, or desert regions in the south and east—can reduce your crash exposure.
Who Is Most Affected: Age, Road User Type, and Urban vs. Rural Patterns
Certain groups—by age, travel mode, or location—are disproportionately represented in serious crash statistics. Recognizing where extra caution helps can inform how you drive and what you watch for, and resources on finding the right personal injury lawyer in California can help injured individuals understand their legal options.
Age Patterns
Adults aged 15-34 represent nearly half of all fatal and serious injury collisions in California, with those aged 25-34 being the highest risk group. Younger drivers (teens and drivers in their early 20s) tend to have higher collision rates per mile due to inexperience and risk-taking behaviors such as speeding and distraction.
Older adults may have lower crash rates overall but experience higher vulnerability to serious injury when a collision occurs. For both groups, awareness and adaptation to personal limitations can help.
Different Road User Types
Pedestrian and bicyclists account for approximately 30% of all traffic fatalities in California. Unprotected road users face significantly higher risks of severe or fatal injury when crashes occur. Motorcyclists face approximately 10 times the risk of fatal injury compared to vehicle occupants in similar scenarios.
Driver recommendations:
- Scan for pedestrians and cyclists at intersections
- Check mirrors before opening doors into bike lanes
- Yield at crosswalks even when turning
- Watch for pedestrians in dense city areas like downtown Los Angeles, central San Francisco, and busy San Diego neighborhoods
Vehicle Types
Collisions involving large trucks, buses, or delivery vehicles can result in more severe outcomes for people in smaller cars due to size and weight differences. Central Valley trucking corridors and port-adjacent routes in southern California see concentrated truck traffic.
Recommendations:
- Leave extra space when following or passing large vehicles
- Avoid lingering in blind spots (if you cannot see the truck’s mirrors, the driver cannot see you)
- Pass trucks decisively rather than alongside for extended periods
Urban Versus Rural Crashes
| Location Type | Crash Volume | Fatality Rate | Key Factors |
|---|---|---|---|
| Urban areas | Higher total crashes | Lower per-crash fatality rate | Congestion, lower speeds, more intersections |
| Rural highways | Lower total crashes | Higher per-crash fatality rate | Higher speeds, fewer barriers, longer emergency response |
| Metropolitan areas like Los Angeles, San Francisco, Sacramento, and San Diego see more total crashes due to traffic density. Rural areas—including routes to national parks, mountain passes, and agricultural regions—experience higher fatality rates per crash, and individuals injured in these incidents can access a free legal advice and accident hotline 24/7 to better understand their rights. |
Tailoring Your Approach
Consider the particular risks associated with how you typically travel:
- Freeway commuters: Watch for sudden stops and rear-end collision risk
- Motorcyclists near Lake Tahoe: Account for wildlife, curves, and weather changes
- Pedestrians in downtown San Diego: Use marked crosswalks and stay visible
- Long-distance drivers through the Central Valley: Plan rest stops and rotate drivers
Practical Safety Tips Tailored to California Roads
This section turns statistics into everyday driving strategies designed for California’s unique mix of mega-cities, small community areas, coastlines, mountain passes, and desert stretches.
Planning Ahead
- Use traffic, weather, and wildfire or storm alerts before driving major corridors (I-5, I-80 to Lake Tahoe, US-101 along the coast, routes into the San Francisco Bay and Los Angeles)
- Check Caltrans QuickMap and 511 services for real-time conditions
- Add extra travel time to avoid feeling rushed and tempted to speed
- Research routes to unfamiliar destinations like national parks or the Silicon Valley area
Safe Spacing and Speed Control
- Maintain at least a three-second following distance in dry conditions
- Increase to four seconds or more in rain, fog, or on winding roads
- Remember that posted limits are maximums—slower speeds can be safer in heavy traffic, poor visibility, or unfamiliar territory
- Reduce speed by 5-10 mph below limits on fog-prone routes like SR-99
Technology Use
- Set up hands-free phone connections before driving
- Pre-program navigation to avoid mid-drive phone handling
- Use modern vehicle safety features (lane-departure alerts, automatic emergency braking, adaptive cruise control) as support tools
- Stay attentive and ready to react—technology supplements, not replaces, awareness
City Driving
In Los Angeles, San Francisco, San Diego, Sacramento, and other urban hubs:
- Scan actively for pedestrians and cyclists at intersections, near transit stops, and in entertainment districts (including Hollywood and beach areas)
- Watch for ride-share pick-ups stopping suddenly in travel lanes
- Check for door openings into bike lanes before passing parked cars
- Allow extra time in congested metropolitan areas
Long-Distance and Scenic Trips
For Central Valley crossings, northern California coast drives, trips to national parks, and Lake Tahoe weekends:
- Rotate drivers when traveling with others
- Stop at safe pullouts or rest areas every 2 hours
- Avoid late-night departures after a full workday
- Bring supplies (water, phone charger, snacks) for remote areas
- Check chain requirements before Sierra Nevada crossings
Ongoing Habits
Treat safety as ongoing—revisit local rules of the road, refresh defensive driving skills periodically, and consider formal courses (like those offered by AARP or California driving schools) if you frequently drive in high-risk areas. Studies suggest refresher courses can improve driving habits by approximately 20%.

What To Do After a Car Accident in California
While this article focuses on prevention, understanding general steps people often consider after a crash is also valuable. In California, individuals injured in car accidents have the right to seek compensation for their injuries, which can include medical expenses, lost wages, and pain and suffering.
Immediate Safety and Emergency Response
- Prioritize safety: check yourself and others for injuries
- Move to a safer location when feasible (shoulder, parking lot)
- Contact 911 for medical and police assistance when there are injuries or significant damage
- Turn on hazard lights to warn other drivers
Information Gathering
- Exchange information with other drivers: names, contact details, insurance information, license plate numbers
- Collect contact details from any witnesses when possible
- Note the location, time, weather, and road conditions
- Record names and badge numbers of responding officers
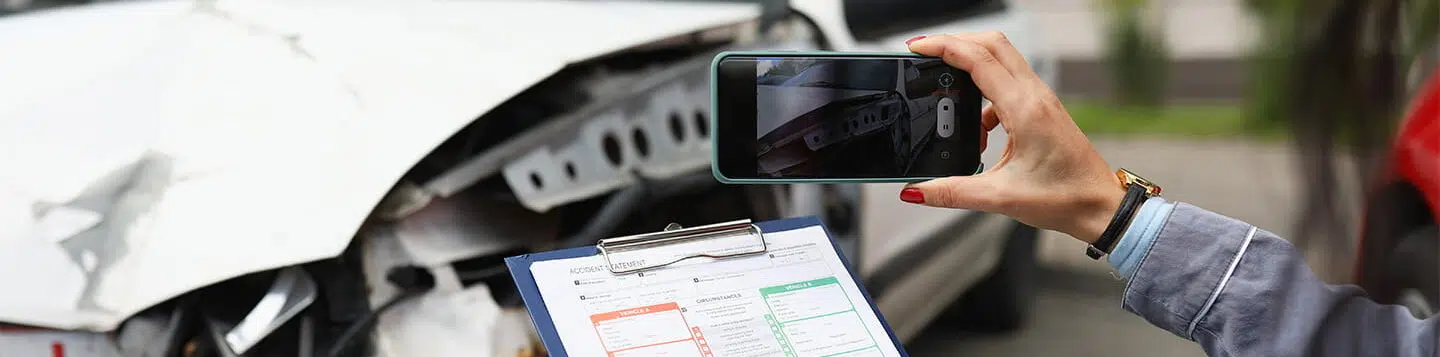
Documenting the Scene
- Take photos or videos of vehicle positions, road conditions, signals or signs, visible injuries, and property damage—if it can be done safely
- Document skid marks, debris, and surrounding landmarks
- Photograph the other vehicle’s license plate and damage
Reporting Requirements
California law may require reporting certain collisions to law enforcement and the DMV, particularly when there is injury, death, or property damage exceeding $1,000. Many insurers also require prompt notice of any crash. Filing reports protects your ability to pursue claims later.
Medical Follow-Up
Consider seeing a medical professional after any meaningful impact, even if you feel fine initially. Some injuries—like whiplash or internal trauma—may not appear for 24-48 hours. Documentation of medical evaluation also supports any future claims.
Legal Consultation
Victims of negligence in California, such as those injured in car accidents, are encouraged to seek legal representation to navigate the complexities of personal injury law and maximize their compensation. People who are injured in a crash caused by another’s possible negligence often choose to speak with a California personal injury lawyer to understand their legal options, timelines, and potential claims.
How 1-800-THE-LAW2 Helps Connect You With California Car Accident Attorneys
1-800-THE-LAW2 is a California legal referral network that connects consumers with independent attorneys. The service does not itself provide legal services or legal representation.
Core Service
Individuals injured in car accidents anywhere in California—whether in Los Angeles, San Diego, the Inland Empire, the Central Valley, northern California, or the San Francisco Bay Area—can contact 1-800-THE-LAW2 to be connected with a member attorney for a free consultation. This applies to crashes on city streets, mountain highways, and everywhere in between.
Availability and Accessibility
- The service operates 24/7 by phone and online
- Available in English and other languages where offered
- Callers can reach out soon after a collision when questions are fresh
Contingency-Fee Structure
California operates under a contingency fee system for personal injury cases, meaning that clients do not pay attorney fees unless they win their case. The attorneys in the 1-800-THE-LAW2 network typically work on a contingency-fee basis in personal injury matters, meaning attorney fees are payable only if there is a recovery. However, clients may still be responsible for case-related costs and expenses. Specific fee arrangements are discussed between the client and the independent attorney during consultation, and learning how a contingency fee works in personal injury cases can help set expectations.
Benefits to the Reader
A consultation can help people understand possible claim elements—such as medical bills, lost income, or property damage—without promising any specific result or amount. Outcomes vary based on the facts of each case and applicable law. The goal is to provide information that helps injured individuals make informed decisions.
Required Disclosure
Legal services are provided by independent attorneys. Attorney [Name] of [City, State] is responsible for this advertisement. (This bracketed information should be replaced with the correct, verifiable attorney name and location before publication.)
Frequently Asked Questions About California Car Accident Statistics and Safety
This article uses the latest full-year data available at the time of writing from sources including the California Office of Traffic Safety, California Highway Patrol (via SWITRS), and NHTSA. Official numbers are released on a delay—typically 1-2 years for final validation—so recent years may reflect preliminary estimates.
Statistics are provided for general information only; results vary by location and situation. For the most up-to-date published figures, consult the original agencies’ websites directly:
California Office of Traffic Safety
California Highway Patrol SWITRS
NHTSA
Collision and injury rates differ among cities and regions like Los Angeles, San Diego, San Francisco, the Central Valley, northern California communities, and the Inland Empire. Factors influencing relative risk include:
– Traffic density and volume
– Road design and intersection types
– Enforcement presence
– Public transit availability
– Local driving culture and behaviors
Even in areas with lower average crash rates, individual behavior—speed choice, distraction avoidance, seat belt use—remains critical for safety. Statistics describe aggregate patterns, not guaranteed outcomes for any individual trip.
Popular drives to and within national parks (Yosemite, Sequoia & Kings Canyon, Joshua Tree) and destinations like Lake Tahoe involve narrow, winding, or steep roads that present different hazards than city streets. The geography, plant life, and diverse landscapes of these areas create unique conditions.
Visitors may be unfamiliar with:
– Snow, ice, or high-altitude weather changes
– Wildlife crossings (deer, black bears, bighorn sheep)
– Limited lighting, guardrails, or cell service
– Curves with steep drop-offs
General advice: Research routes in advance, check park and Caltrans road reports, and adjust speed and following distance for changing conditions. The history and natural beauty of these areas deserve respect—as do the roads leading to them.
Statewide and regional statistics describe patterns across millions of trips and do not predict what happens to any specific person. Your individual risk depends on factors including:
– How often you drive
– When and where you travel
– Your driving habits and vehicle condition
– Choices made by other drivers sharing the road
Treat statistics as a tool to identify common danger zones and behaviors, then focus on controllable habits that can help reduce your own exposure. Representatives from traffic safety organizations emphasize that more than half of crash risk relates to human factors you can influence.
Many people consider contacting an attorney after a crash when they:
– Have injuries requiring medical treatment
– Face medical bills or time away from work
– Have questions about fault determination
– Receive confusing communications from insurance companies
A consultation with a California personal injury attorney can help clarify legal options and timelines, but does not guarantee any outcome—results vary based on case facts and applicable law.
1-800-THE-LAW2 can help connect individuals injured in California crashes with independent attorneys for a free consultation. As noted earlier, attorneys in the network typically work on a contingency-fee basis, and clients may be responsible for certain costs. Legal services are provided by independent attorneys.
California’s ranking among states for traffic incidents reflects its massive population, extensive road network, and diverse geography—from sea level coastal routes to the highest peak at Mount Whitney, from the Mexican border region in the southeast to the northwest redwood forests, from the center of Silicon Valley to the inland desert communities in the east. Whether you’re navigating September traffic returning from a summer lake trip or a holiday journey through the country’s most complex freeway systems, understanding patterns and adjusting habits can help protect you and everyone sharing the road.
Statistics are historical and illustrative. Safe driving remains a daily practice, not a one-time achievement. If you or a loved one are injured in a crash, remember that help is available—1-800-THE-LAW2 can connect you with independent California car accident attorneys for a free consultation to understand your options.
This article is for general informational purposes only, is not legal advice and does not create an attorney-client relationship. Results vary based on the specific facts and law applicable to each case. This content was created with AI assistance and reviewed for accuracy, including the images contained herein. Hiring a lawyer is an important decision and should not be based solely on ads. No claim is made that participating attorneys are better than others.